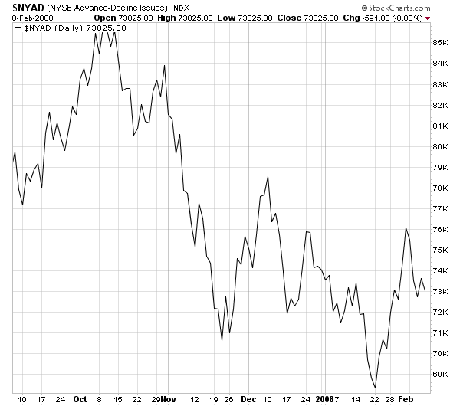
By almost any measure, the stock market has lost its downside momentum here. For starters, new lows on the NYSE remain below 100; at their bottom three weeks ago, there were more than 1,000. The S&P 500 is only 1.6% above last month’s closing low of 1310, yet the number of stocks making new 52-week lows has fallen by more than 90% during that time. The advance-decline line (first chart below) also is holding well above its lows here.
Sentiment also largely favors the bulls, particularly when you look at where money is being put to work. Commercial futures traders are getting long the big S&P contract while small investors are cautious if not short. And the 20-day average of the ISEE options index fell to 97 earlier this week, its lowest level since October 2002, when it hit 95.
But we still need to see stocks turn higher with conviction to cement a bottom here.
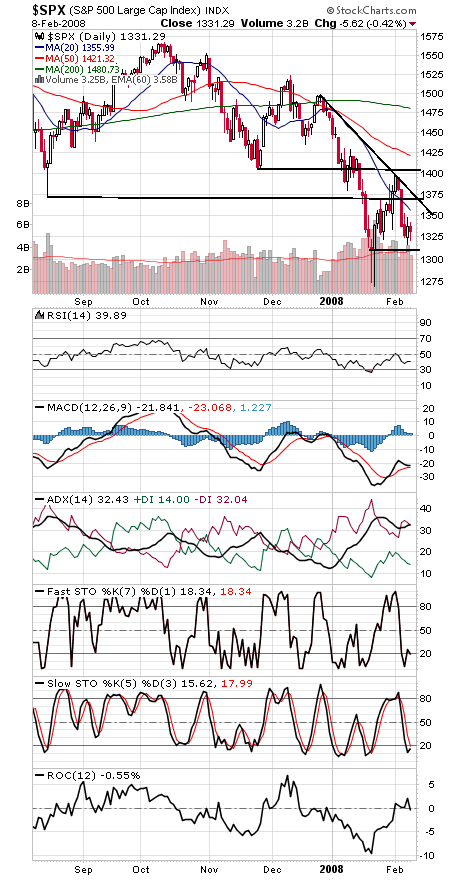
The S&P 500 (second chart) needs to get above 1370-1380 and stay there. First resistance is 1335 and 1343, and support is 1321-1323, 1316, 1310, 1300 and 1270-1275.
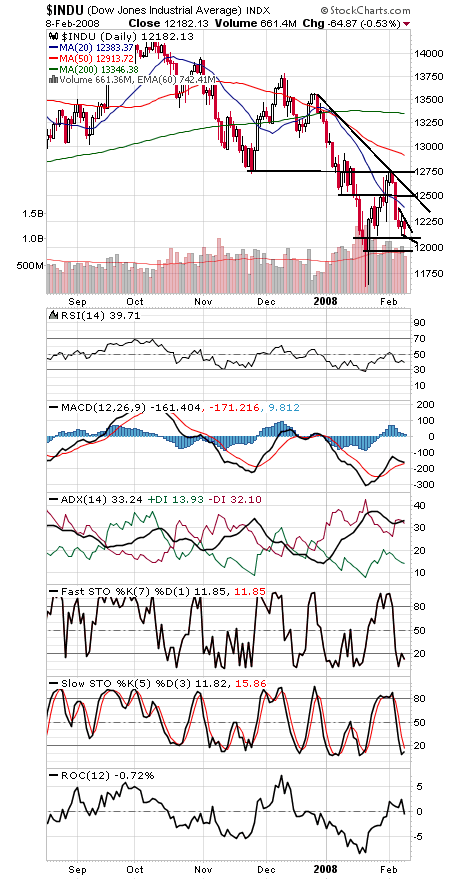
The Dow (third chart) has support at 12,092 and 11,971-12,000. The first hurdle is 12,225-12,275, and 12,500-12,800 is a big resistance area.
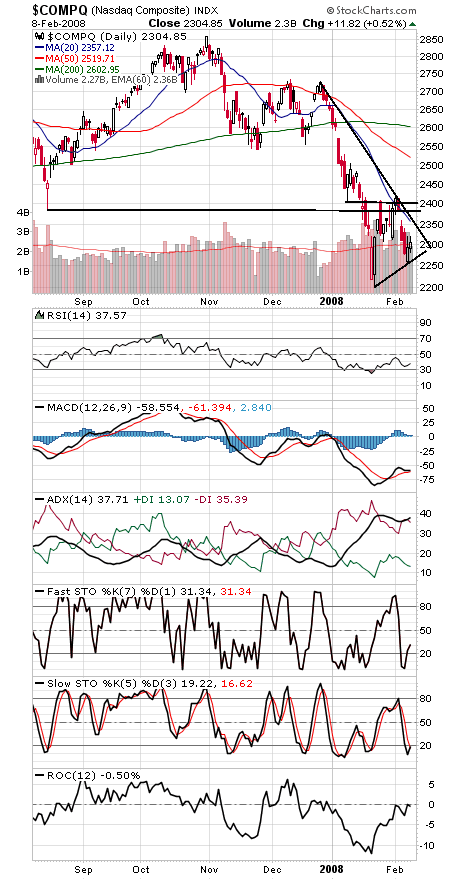
The Nasdaq (fourth chart) has support at 2290 and 2265, and resistance is 2310-2320, 2350-2355 and 2387-2400.
Paul Shread is a Chartered Market Technician (CMT) and member of the Market Technicians Association.