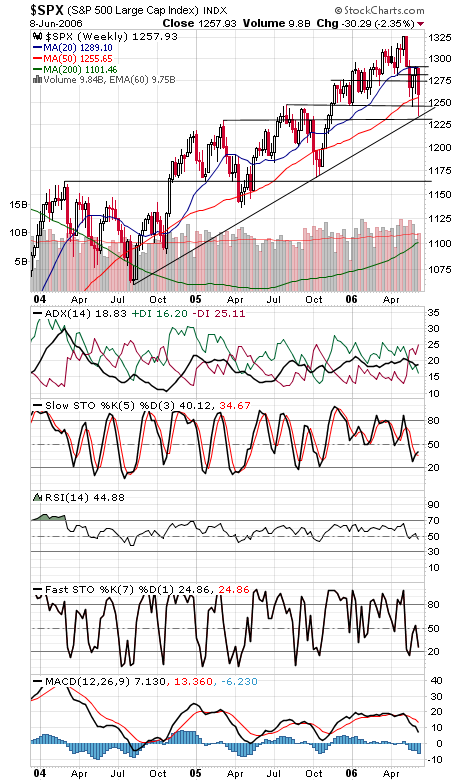
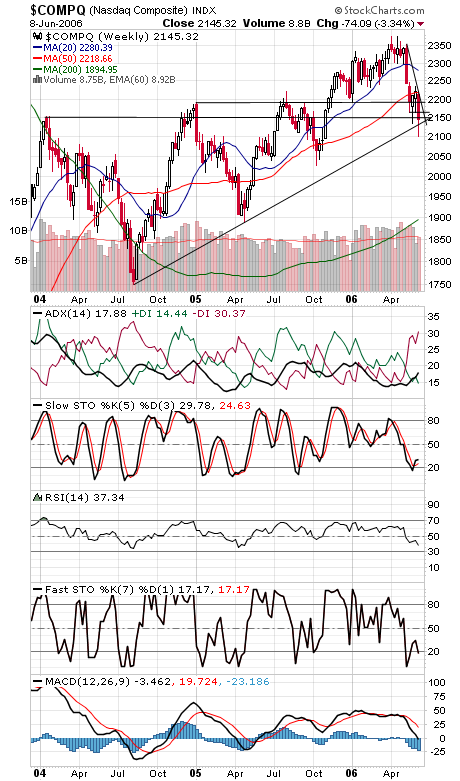
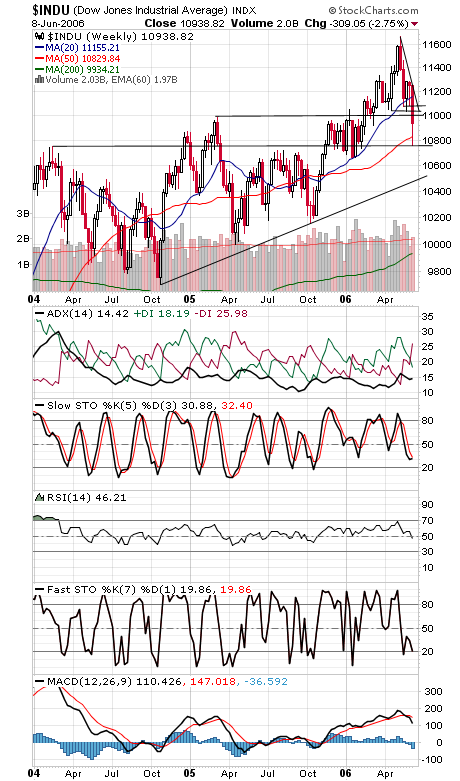
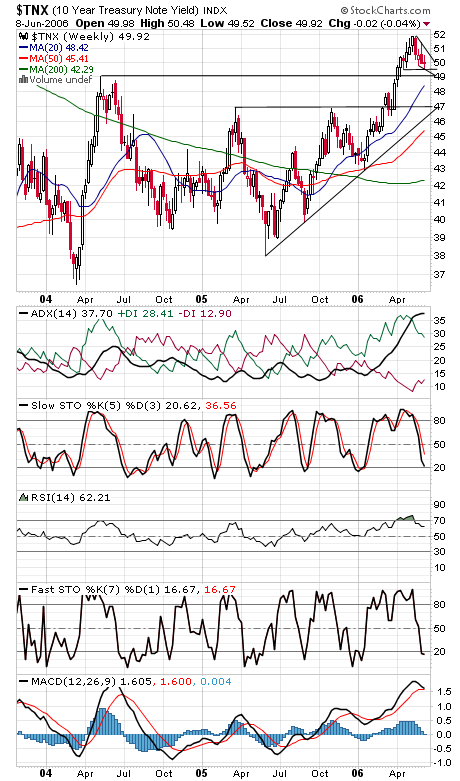
The S&P (first chart below) saved the day today. 1230-1235 looks like pretty critical support on the index; 1165 looks like the next strong support level below that. First supports are 1255 and 1245, and resistance is 1261, 1270, 1275, 1281 and 1290. The Nasdaq (second chart) has made no progress since the first leg off the 2003 lows ended 2 1/2 years ago. Tough going for the tech sector for some time now. Support is 2135 and 2100, and resistance is 2165, 2185-2190 and 2200. The Dow (third chart) could hit 10,500 if today’s low at 10,750 doesn’t hold. First support is 10,875, and resistance is 11,030-11,040 and 11,077-11,100. Still no definitive move from long bond yields (fourth chart).