It’s genuinely ugly out there, and perhaps the ugliest thing of all is that sentiment gauges have yet to show much in the way of fear.
Put-call ratios and sentiment surveys are nowhere near the extremes they hit just a few months ago, which suggests that stocks may need to fall further to generate the capitulation necessary for a major bottom.
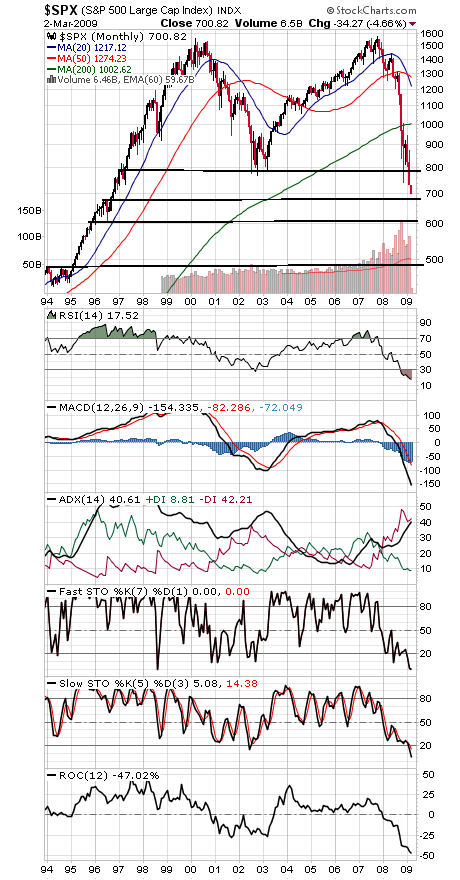
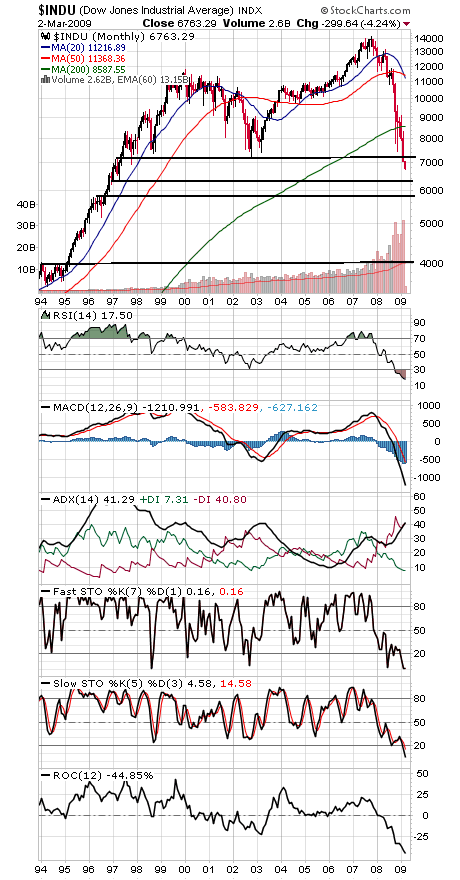
The Dow and S&P (first two charts below) are giving up 10-year trading ranges here, and those old lows are now likely to become formidable resistance. Those levels begin at 741-752 and 768-804 on the S&P and 6971-7192 and 7450-7552 on the Dow.
So how low can stocks go?
The S&P’s next support zone is right here, at 680-700, with 600-620 below that, while the Dow has potential support at 6300-6500 and 5800-6000.
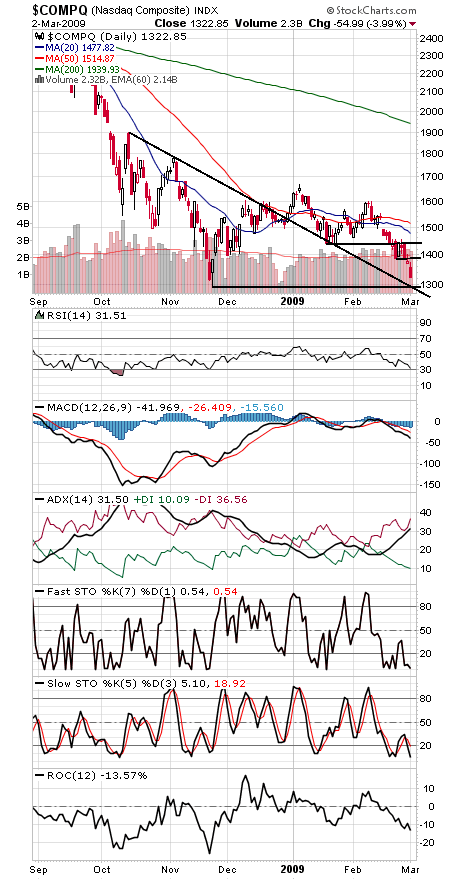
The Nasdaq (third chart) and the broad market may be performing better, but that’s been little help. The Nasdaq’s November low was 1295.48, with 1253 the last strong support before the 2002 low of 1108. To the upside, the Nasdaq faces resistance at 1386-1400 and 1434.
And finally, the Wall Street Journal noted today that former Fed Chairman Alan Greenspan recently related how in the late 1950s he found that stock prices and corporate equipment orders were related, a relationship that he said continues to hold true. Just one more reason why the study of stock market movement is anything but academic. It is the ultimate predictor of corporate and consumer spending, and the message continues to be bleak.
Paul Shread is a Chartered Market Technician (CMT) and member of the Market Technicians Association. He is a co-author of an upcoming book on Dow Theory from W&A Publishing.