Investors appear to be focused on tomorrow’s jobs report, since little else has moved the market this week. So while we’re waiting, we’ll cite the same data we do every year at this time: according to Robert Colby’s Encyclopedia of Technical Market Indicators — a book worth getting if you’re interested in the performance of technical indicators — exiting longs and selling short every year on September 5 and buying on October 27 would have been a profitable strategy that would have outperformed buy-and-hold by 3,014% during the last century and would have been right 62% of the time. If nothing else, we’re entering a time of year when caution is warranted. It’s worth noting that the pattern in recent four-year cycles (2002, 1998 and 1990, for example) has been for the major buy point of the year to occur in the first half of October, so the next six weeks may turn out to be interesting ones.
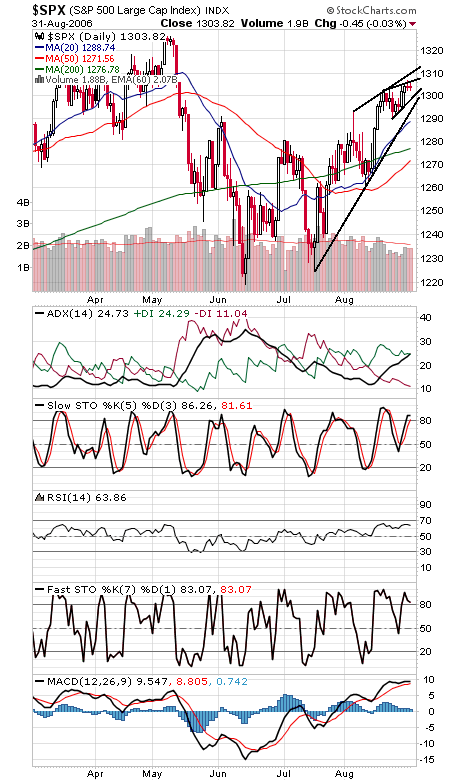
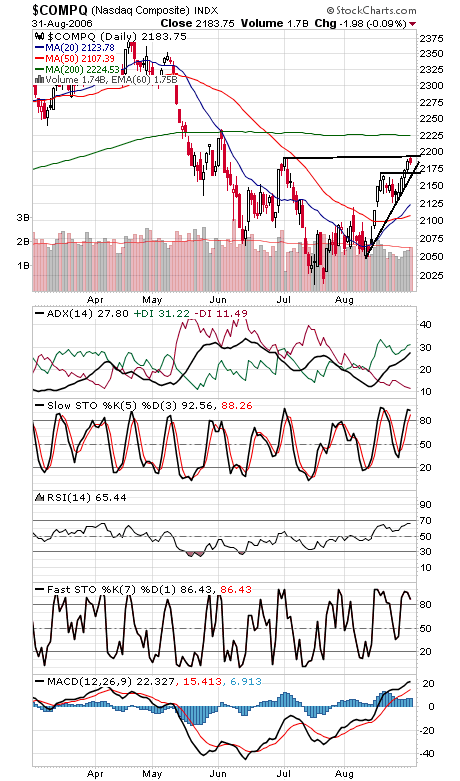
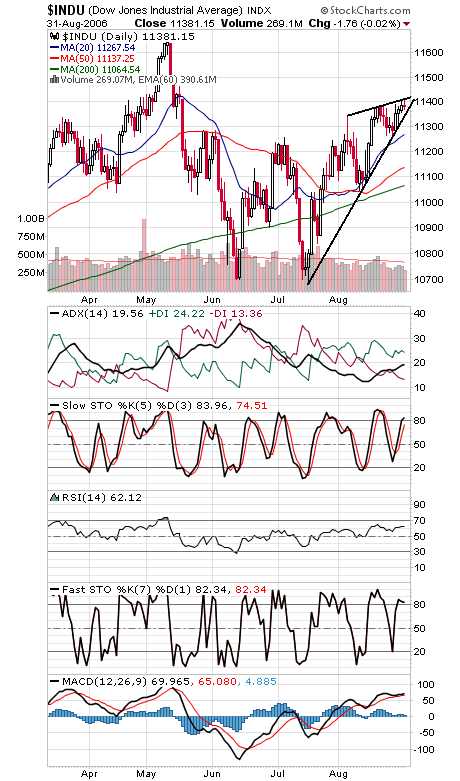
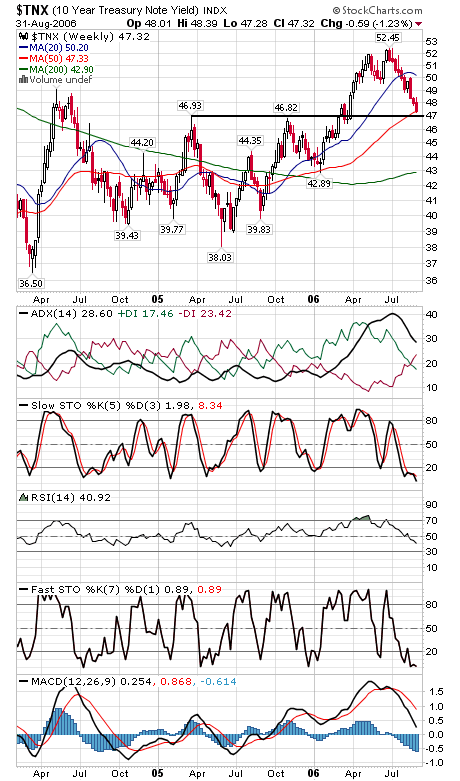
The S&P (first chart below) continues to “wedge out” here heading into the weakest month of the year, but that pattern could use one more touch of both the lower (1300) and upper (1307) trendlines before topping out. If the index can clear 1306-1307, 1310-1311 is next, while 1295 is a big level below 1300. The Nasdaq (second chart) stalled out at 2193 today, with 2200 and 2225 above that. 2168-2173 is important first support. The Dow (third chart) may also be wedging out here, with resistance at about 11,415 for tomorrow, and support at 11,365. The amazing bond rally (fourth chart) continues; can yields take out the major 4.7% level?